I got a reaction on my previous post by Andy Kriebel with some remarks (thanks!) on my first visualizations. And he’s right. No need to put a lot of coulours in your graphs (backgrounds, titles, …) because they only distract the reader. Less is more again. I also reversed the ordering, so that it is clear that thje top word is ‘the’. Here’s the reworked graph (click to enlarge):

His second remark was about the visualization of the most occuring ‘meaningfull words’ in the bible. Here ‘more is more’ as in ‘explaining the graph’ so the user clearly understands what you are trying to show.
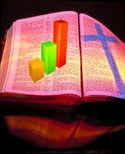
The background colours are overdone, but different colours for every word are very usefull here as it makes the graph better readable. Removing the legend and putting the labels in the chart itself also helped readability. The reworked version of the chart and a better explanation :

Of course the words that occur most in the bible are ‘meaningless’ words as ‘the’, ‘and’, ‘or, etc… This chart show the occurence throughout the bible of the top 20 ‘meaningfull’ words.
As you can see, moses and david occur more in the ‘old testament’ and the name jesus only appears in the second half (new testament).